Tutorial 01: Overview of the platform
FASTGenomics is an online platform for single-cell analytics, where you can analyze your data in a reproducible and maintained environment. If you have problems with setting up a state-of-the-art software environment for the analysis or if you would like to generate a reproducible study, FASTGenomics will be very helpful for you. With FASTGenomics you can
- upload and share your data with colleagues
- analyze your data using state-of-the-art analysis technique provided by Scanpy and Seurat
- showcase your results to others
You don’t need to waste time with installation, updating your software environment, or how to share data and results. FASTGenomics is taking care of that for you.
In this short tutorial we give you a short overview of the features and functionality of our platform. After you logged in as a registered user, you are guided to this startup page.
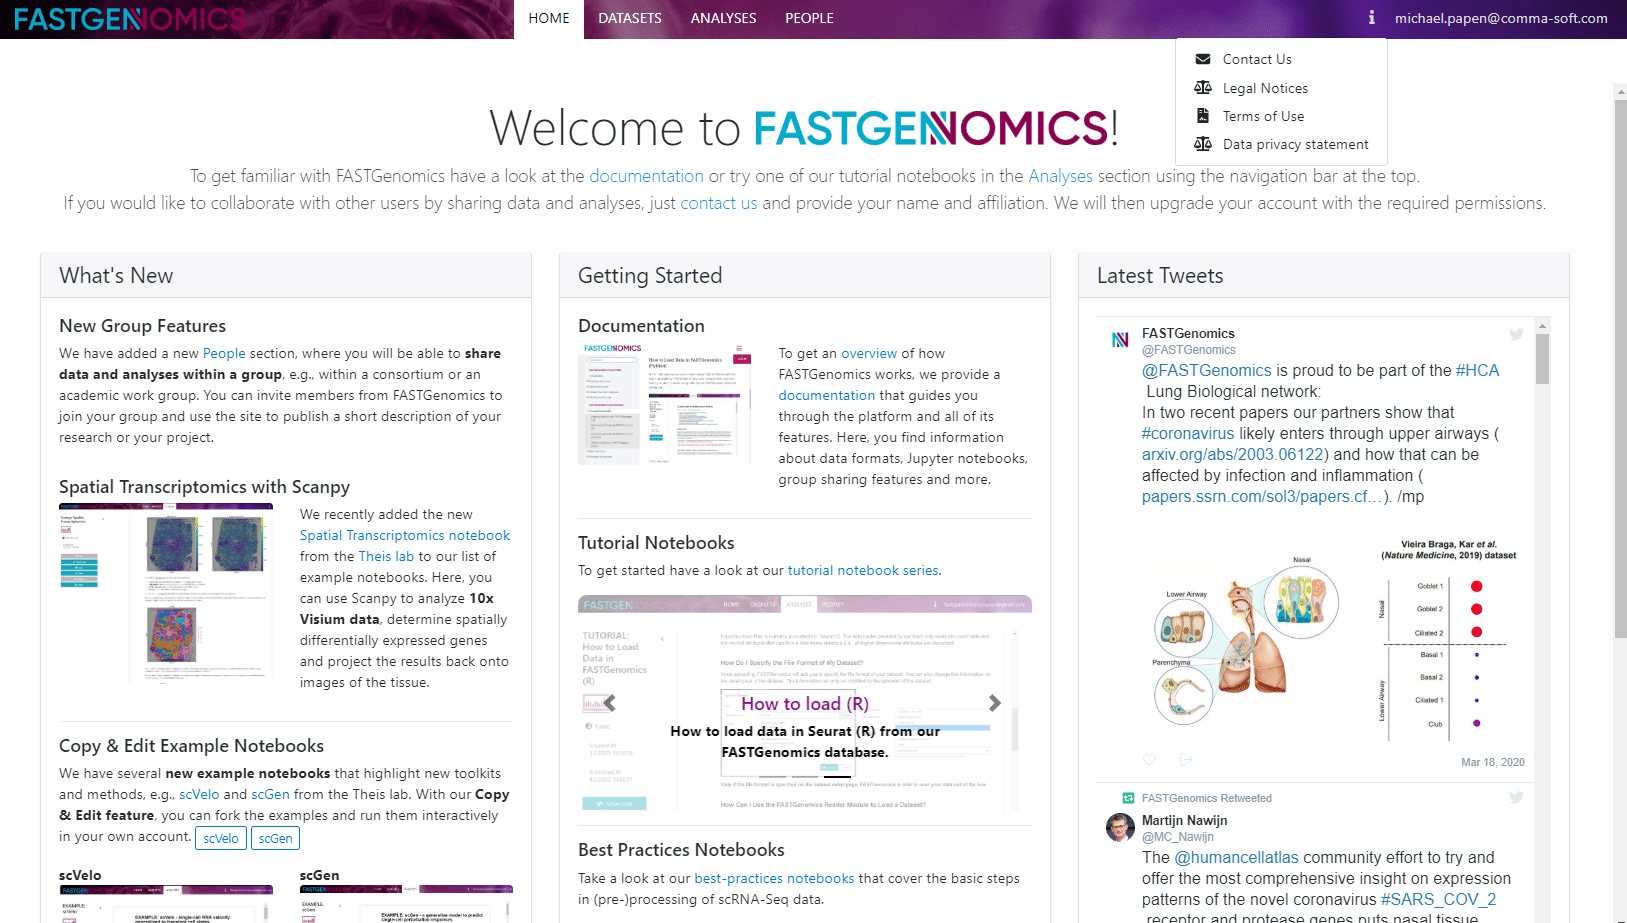
At the top, you find a menu with the publicly available datasets and analyses. On the right, you find an information button and your user profile menu.
- Datasets will take you to the FASTGenomics internal database. Here you can upload and share your own data and access publicly available datasets.
- Analyses will take you to a list of publicly available analyses, each realized in a Jupyter notebook. Here you can also create and share your own analyses.
- Information lists our contact email, legal notices, terms of use and our data privacy statement.
- User profile: Here you can manage your user profile or log off from the platform.
Let us have a look at the datasets.
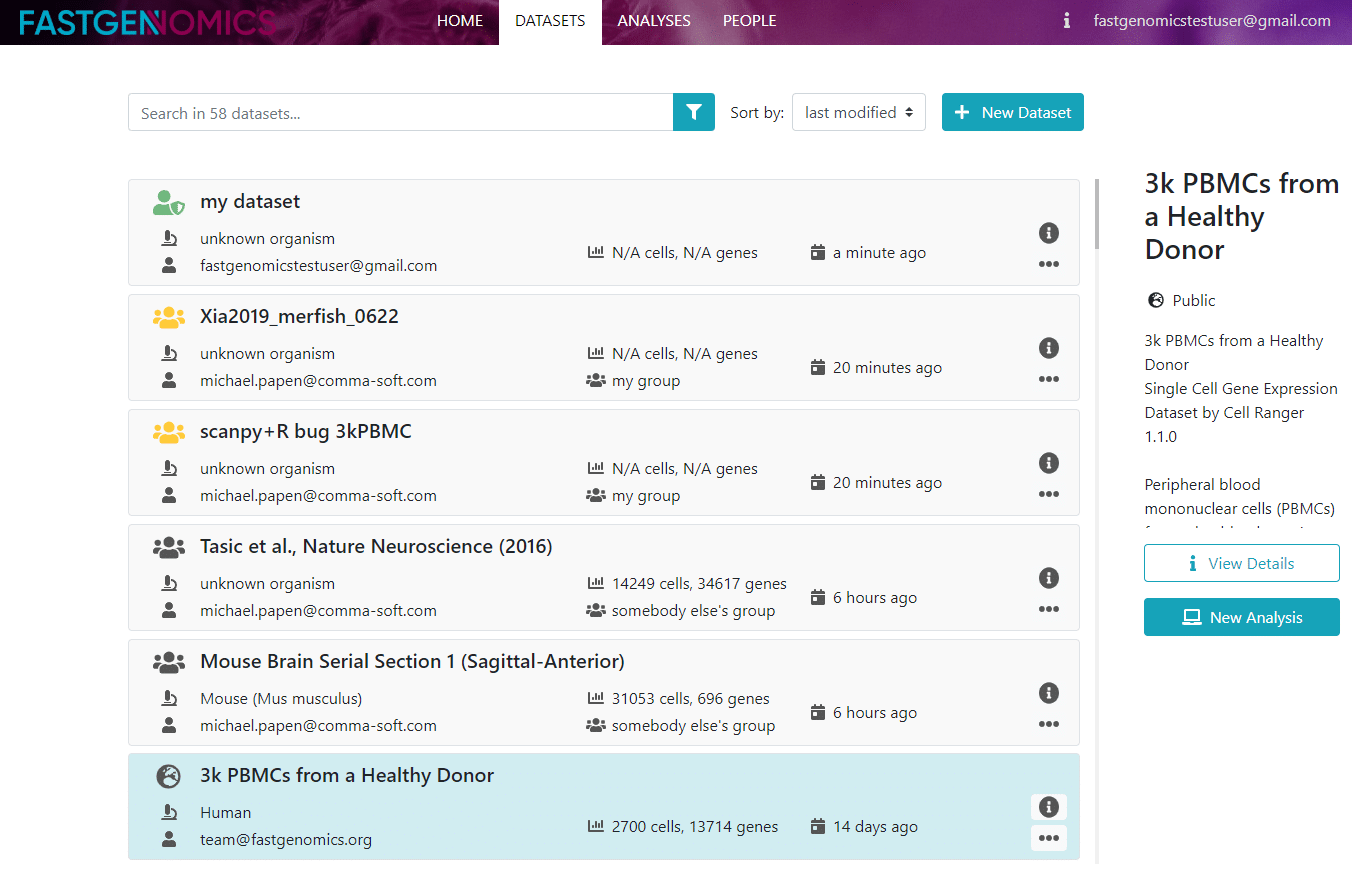
Here, all available internal datasets are listed. Note, that if your dataset of choice is not here, you can either upload it, or load it from within the Jupyter notebook. If you click on a dataset, you will see a short description on the right. Here you have the option to view details and, if the datasets belongs to you, to share the dataset with others. If you click on view details, you come to another page where you can access the metadata.
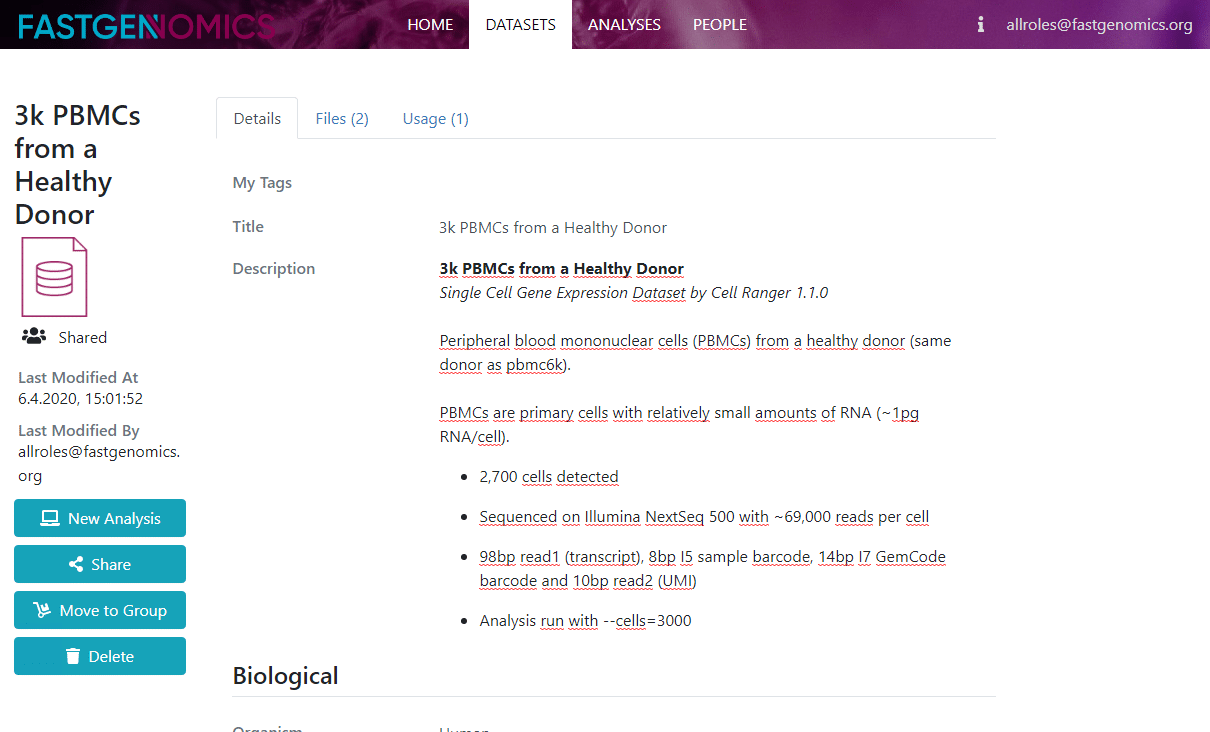
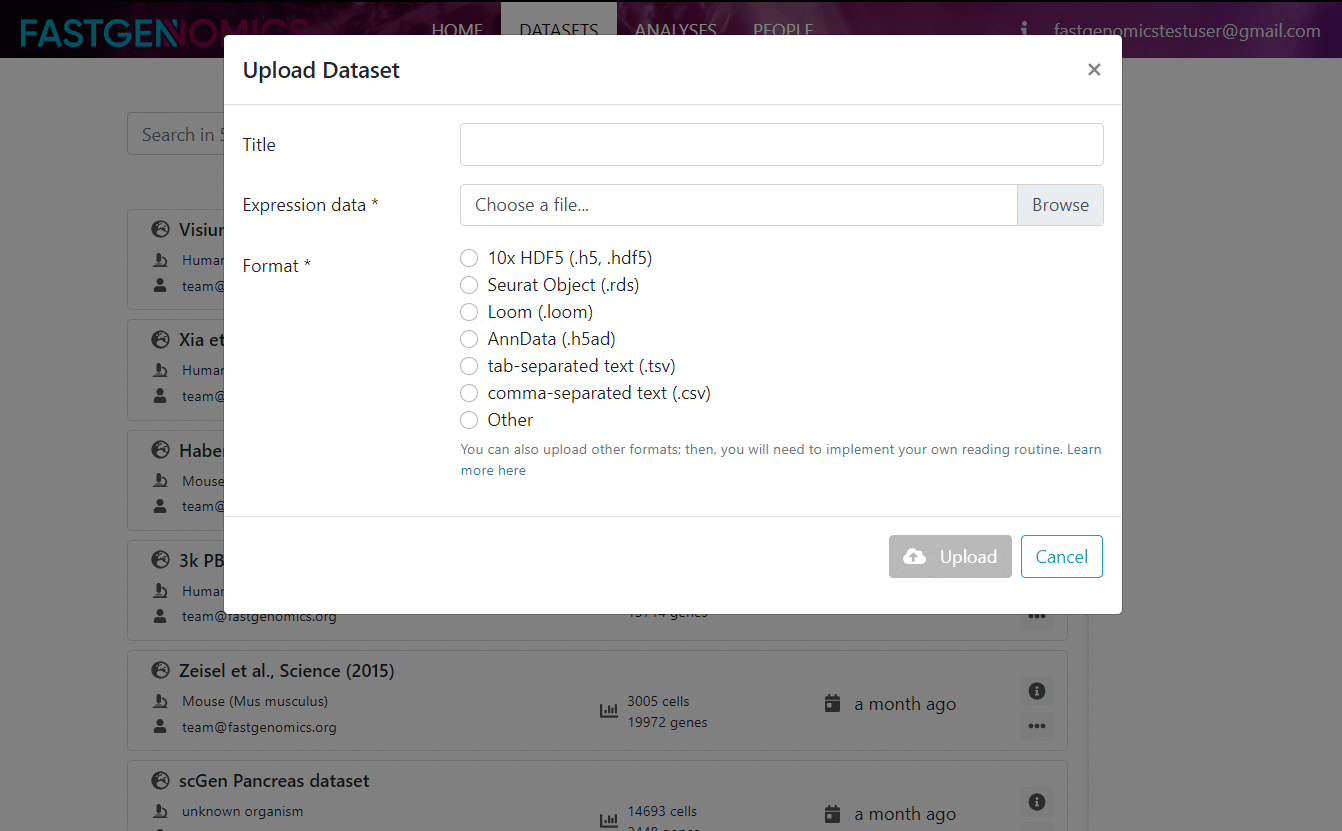
Here, you find a more detailed description of the data and its metadata as well as links to the citation and to the original data repository. If you would like to upload your own data, you can click on the plus sign on the datasets page and you will be guided through the data upload process as shown in the next Figure.
Let us now have a look at the analyses section. After you click on analyses, you come to a similar page as for datasets, where you can browse through the available analyses.
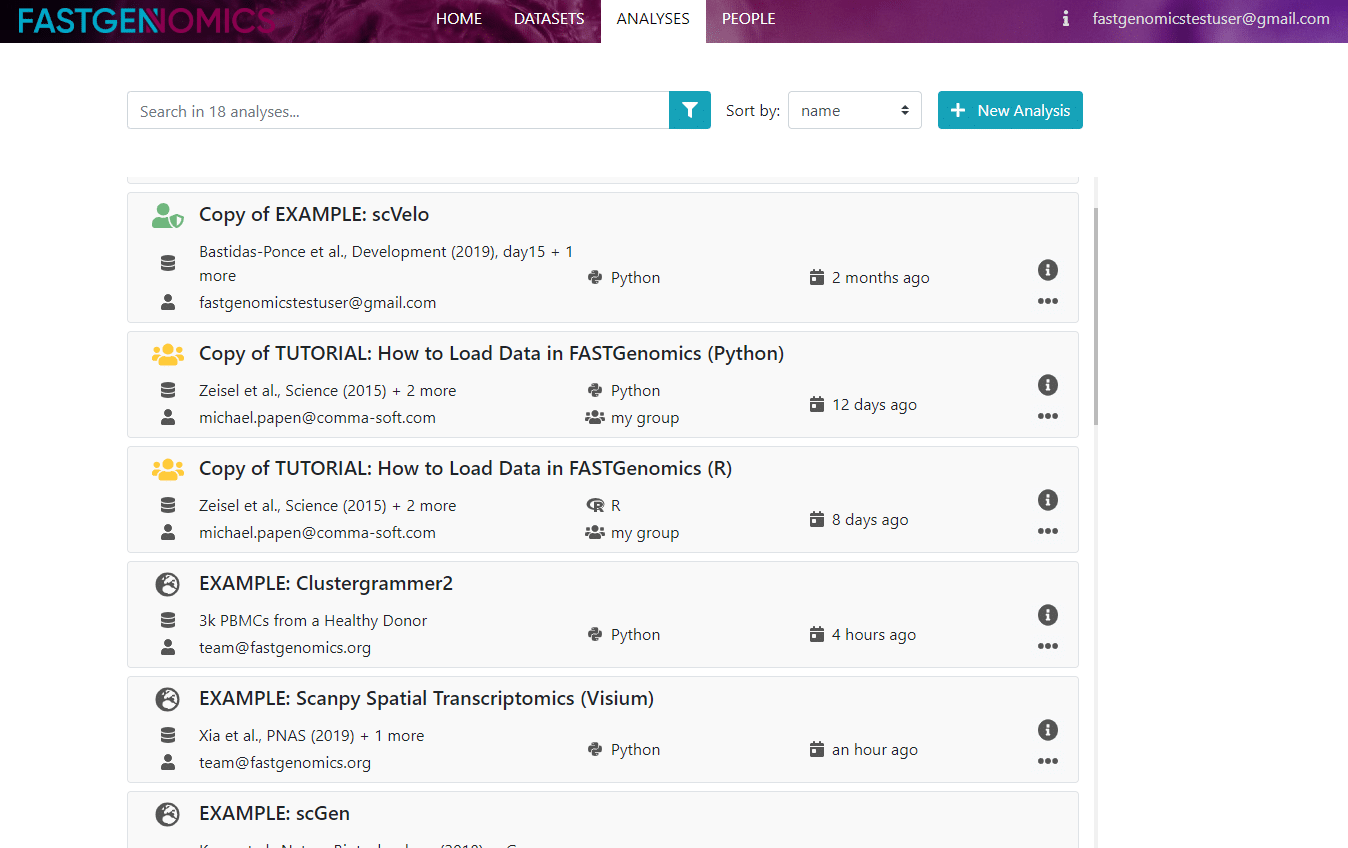
In the middle of the page you see a table of analyses, with title, dataset, workflow, programming language and creation date. If you double-click on an analsysis, you can view its results in a static html. If the analysis belongs to you, you can also open it in an interactive Jupyter notebook. If you are new to Jupyter notebooks, don’t worry. They are very easy to handle and you will find some very good tutorials online, e.g., here.
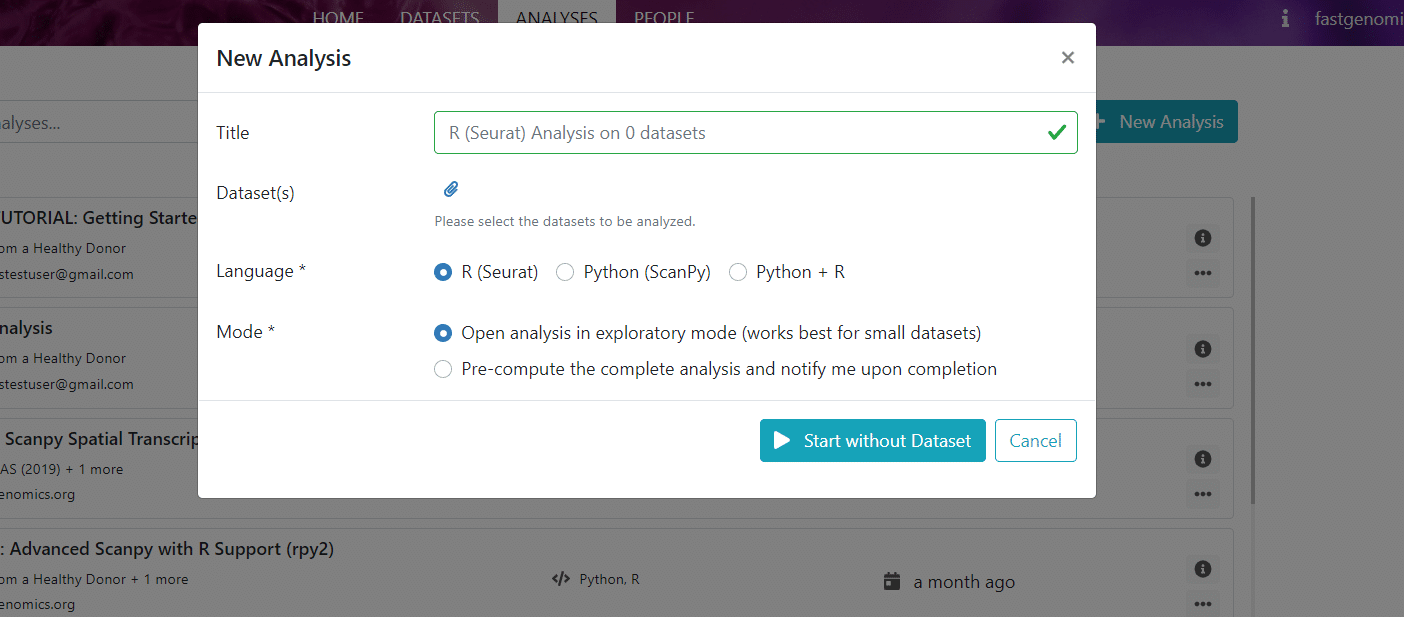
What we refer to as a workflow in FASTGenomics is a Jupyter notebook with analysis instructions together with a given software environment, e.g., Scanpy or Seurat. This workflow is applied to a certain dataset. If you click on new analysis, you can see how this works and you can choose from the available workflows to start with.
This already concludes our first tutorial. If you are interested to learn more about uploading and sharing data and creating your own analysis, check out our other tutorials. You can always get in touch with us via email or twitter, or you can join our slack community, where our experts and fellow researchers will happily answer your questions.