Tutorial 03: Create your own analysis
In this tutorial we will explain how to create your own analysis. As you may know, in the analyses section you can find a list of publicly available analyses. What we refer to as an analysis consists of a software environment and a Jupyter notebook that contains the sequence of analysis tasks applied to a specific dataset. According to our naming convention, the analysis title should contain the name of the analysis platform (Seurat, Scanpy, etc.) and the dataset.
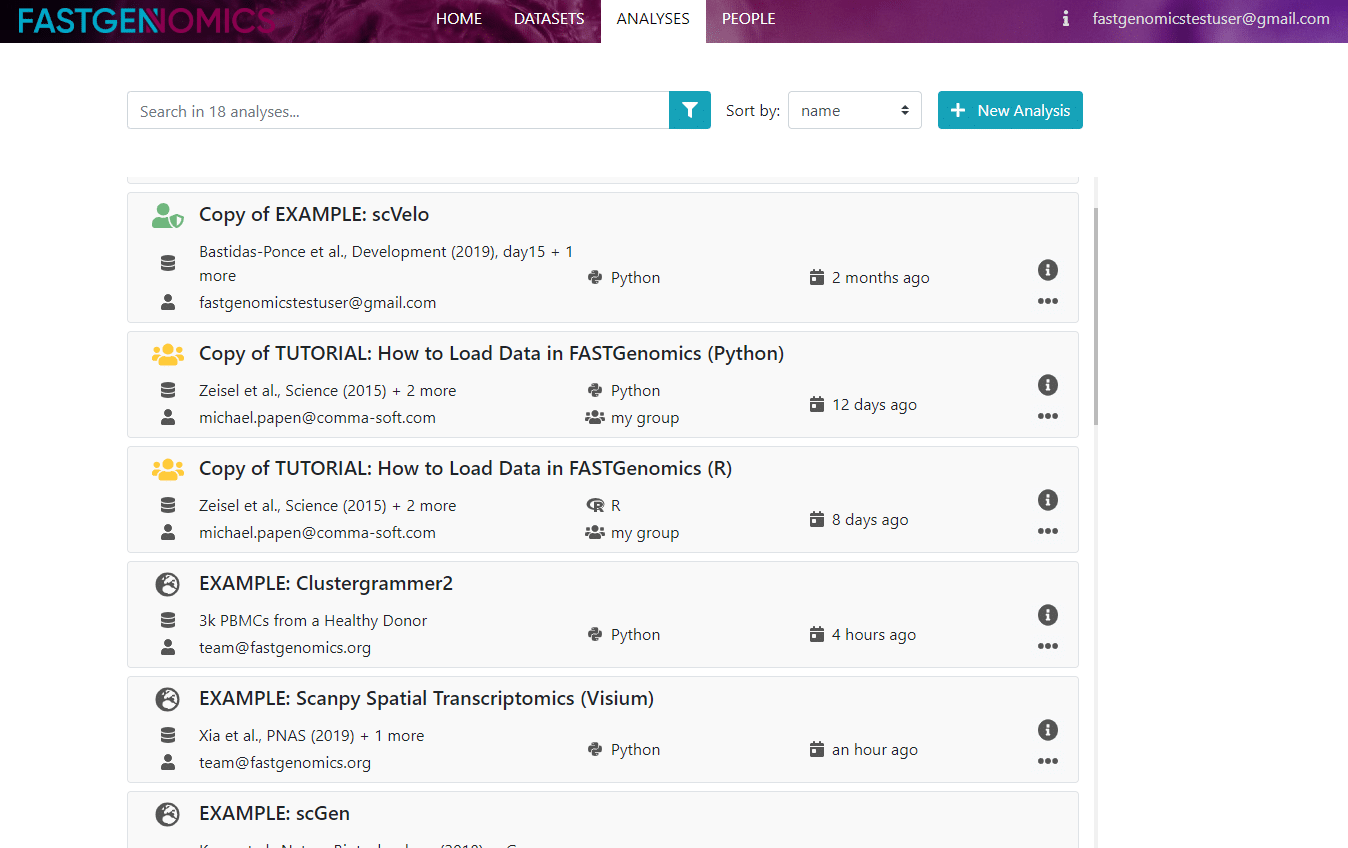
As a new user, you have the rights to create an analysis. To do so, just click on the green button with the plus sign in the top right corner and a new window pops up, in which you can define your analysis. Note that if you would like to use your own dataset, it has to be uploaded to FASTGenomics before creating the analysis (see also our tutorial on how to upload data).
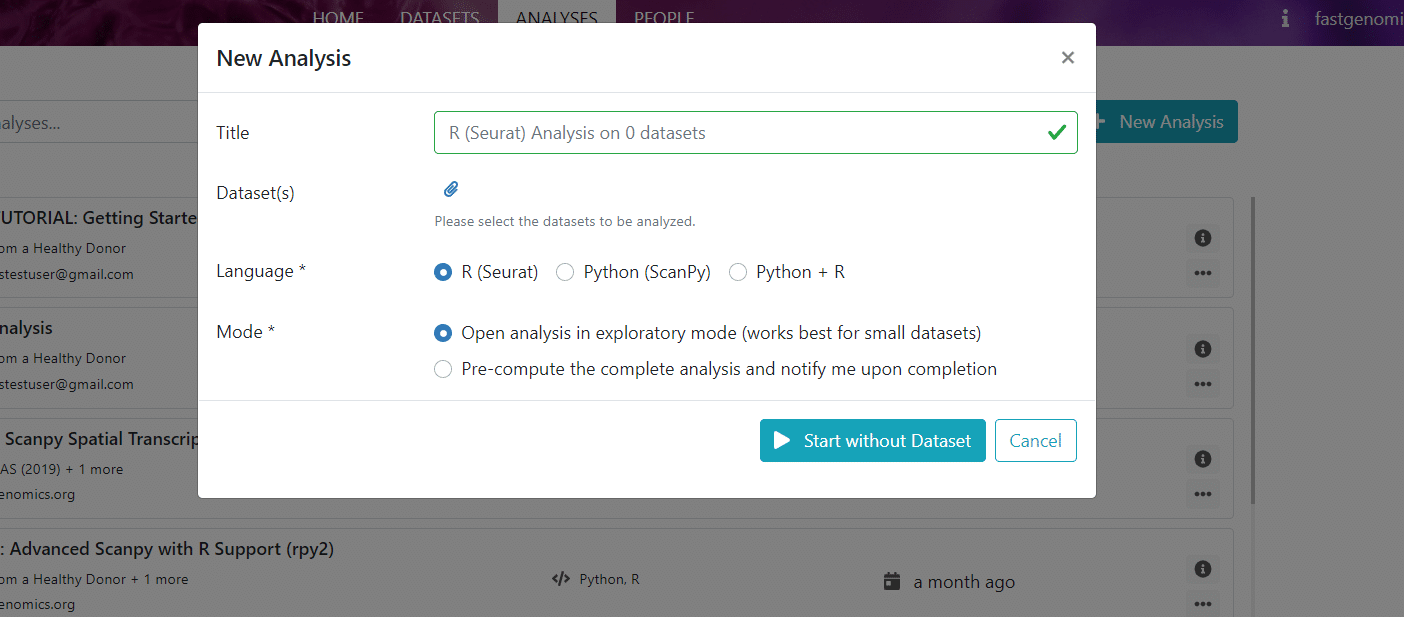
The required information to create an analysis is
- Title of your analysis, ideally mentioning the dataset and the analysis platform (Seurat, Scanpy, etc.)
- Dataset, which your analysis is applied to. The selected data will be loaded from the FASTGenomics database into a folder of the FASTGenomics lab environment. From there, it is accessible by our fgread module from within the FASTGenomics notebook.
- Workflow, or rather the software environment your analysis is working in. This can be e.g., Seurat or Scanpy, and you can also choose a preexisting best-practices workflow, e.g., the LIMES workflow or a generalized version of the Lücken & Theis (2019) best-practices workflow.
- Mode, where you have to choose if you would like to work on the analysis interactively in exploratory mode in the FASTGenomics lab or if you would like to run the workflow blindly in the background, which we refer to as batch mode. As the batch mode only makes sense for preexisting best-practices workflows, let’s choose exploratory here.
From time to time, we will add new workflows to the list in order to provide you with the latest analysis techniques. At the moment, you can choose from these
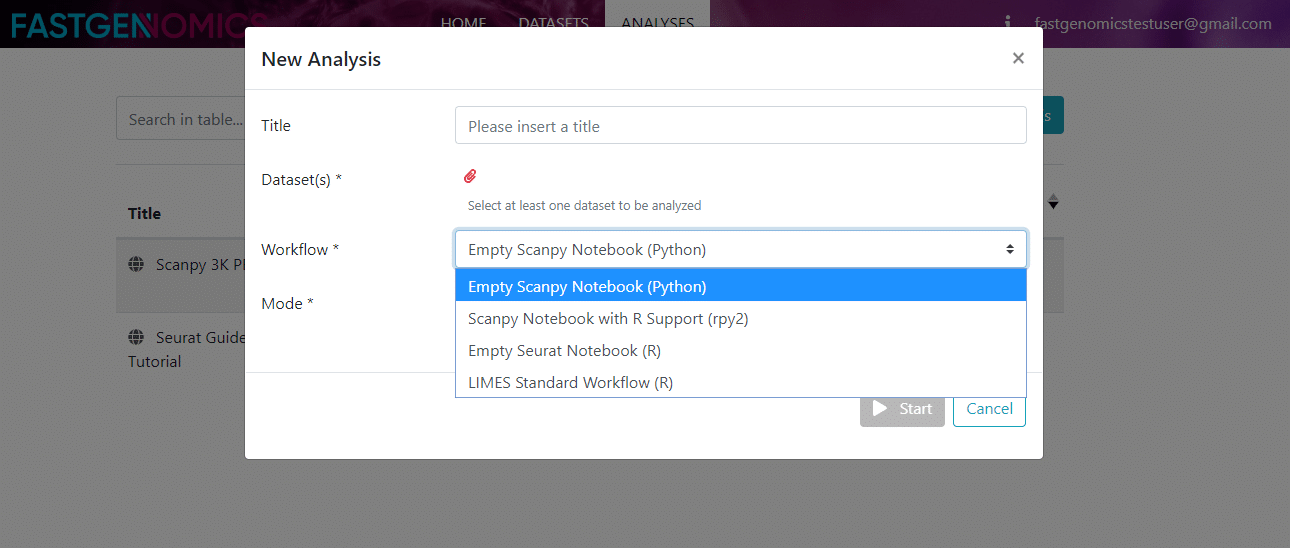
- Scanpy: Here, the Scanpy analysis platform is provided by the workflow Empty Scanpy Notebook (Python), which just handles the data import for you. The environment is Python 3 with the standard modules and packages required for single-cell analysis with Scanpy.
- Seurat: the Seurat analysis platform is provided by the workflow Empty Seurat Notebook (R), which just handles the data import for you. The environment is R (v3.6) with the standard modules and packages required for single-cell analysis with Seurat.
- Scanpy with R support: This is an extended version of the Scanpy workflow with additional support for calculations in R, which is realized using the rpy2 package. This Scanpy Notebook with R Supoort (rpy2) workflow is very powerful and was originally created by the Theis group (see their single-cell-tutorial on git).
- LIMES Standard Workflow (R): This workflow is a Seurat-based best-practices workflow as applied by our partner the Schultze lab at the LIMES Institute at the University of Bonn, Germany. It consists of multiple preprocessing steps (QC, filtering, normalization, etc.) and in the end includes clustering, cell type annotation and DE genes analysis.
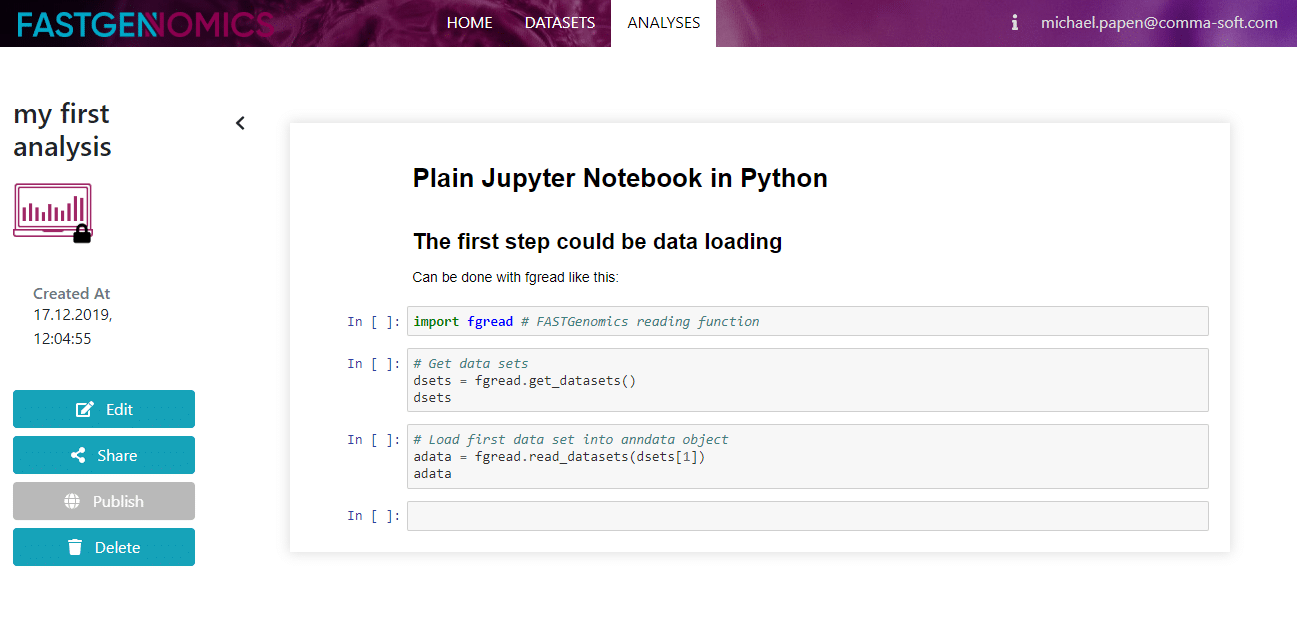
After you entered all required information, you will be redirected to the FASTGenomics lab. Here a Jupyter notebook with your preselected workflow will startup and will guide you through the first steps of importing modules and loading data. From here on, you can freely explore your data.